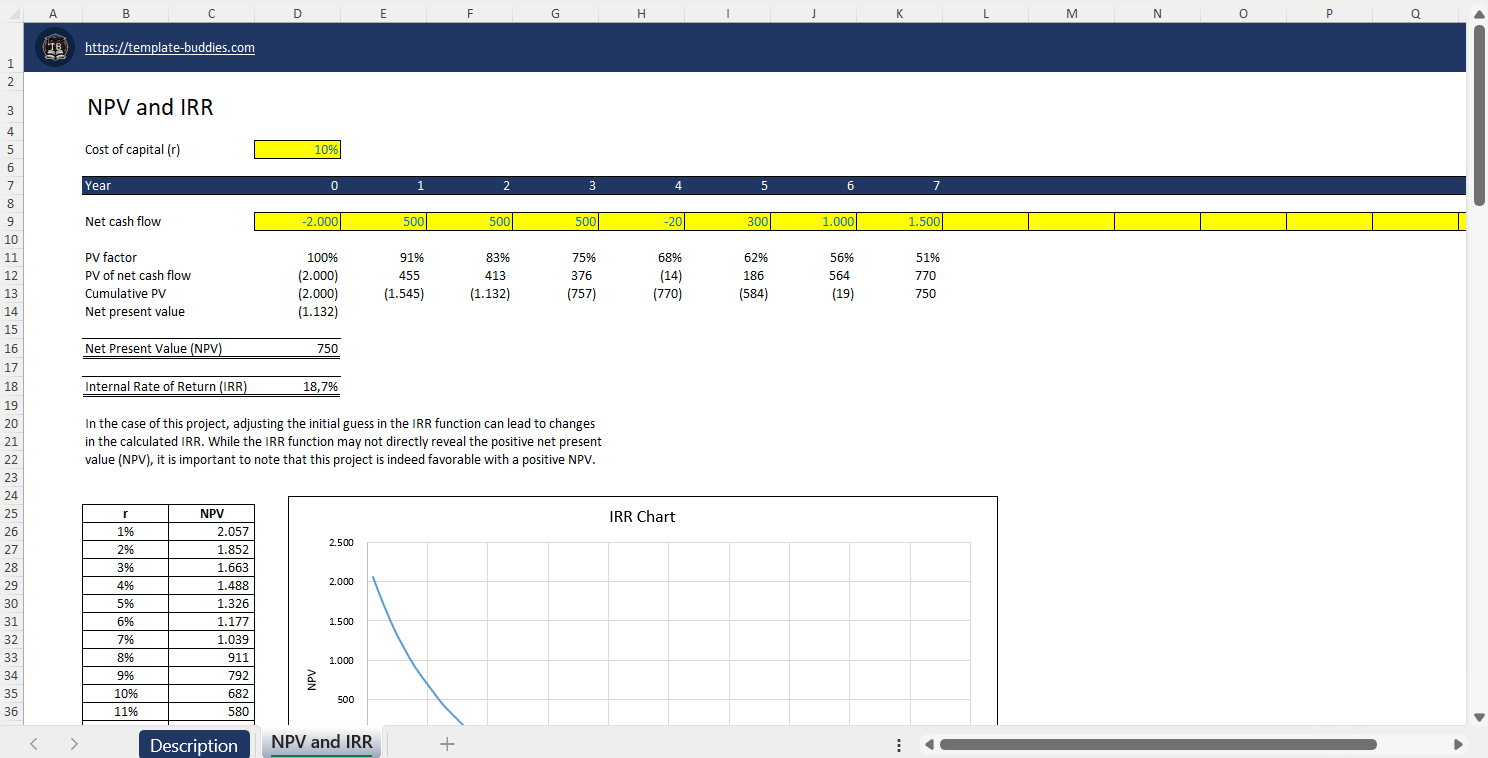
The Internal Rate of Return (IRR) chart is a graphical representation that illustrates the relationship between different discount rates and the Net Present Value (NPV) of a project or investment. It helps identify the discount rate at which the NPV becomes zero, indicating the rate of return where the project breaks even.