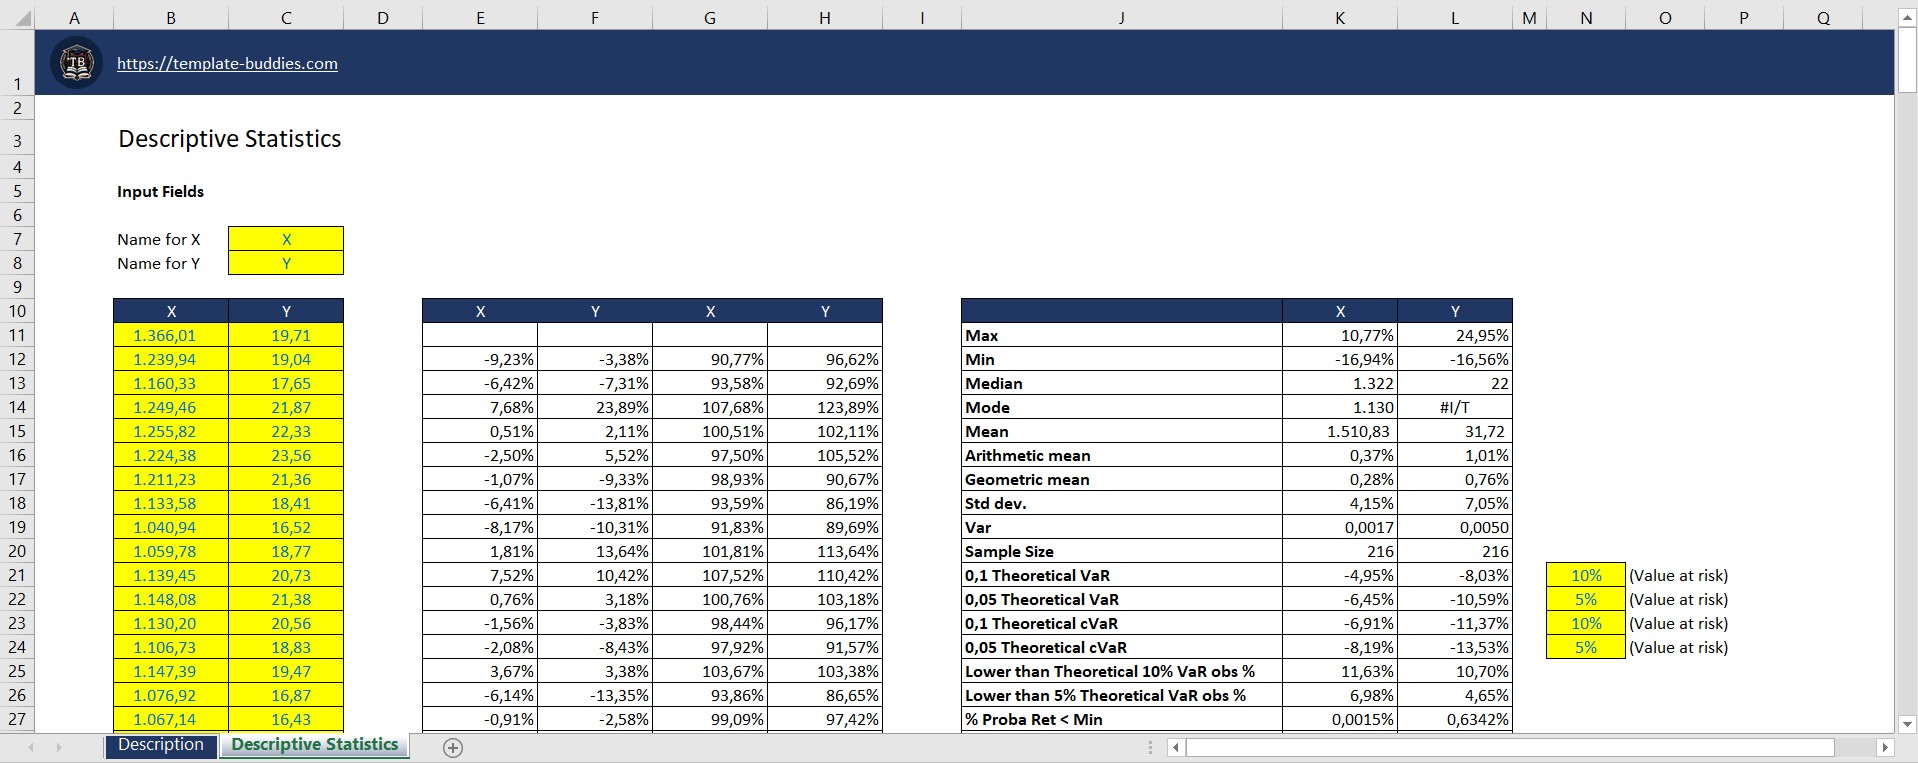
Descriptive statistics summarize and organize data to make it easier to understand and interpret. It includes measures like mean, median, and mode (central tendency), as well as range, variance, and standard deviation (variability). These techniques help present data visually through charts and graphs, highlighting patterns and key characteristics without making predictions or inferences.
Related products
-
Capital Market Theory
Financial Markets and Investments by Claus Munk (2019) – All Solutions
Read more